South Korea’s declining potential growth rate is not a new phenomenon. In the early 2000s, the country recorded growth rates approaching 5%, but now it is projected to fall below 2%, heading towards a 1% growth rate in the future.
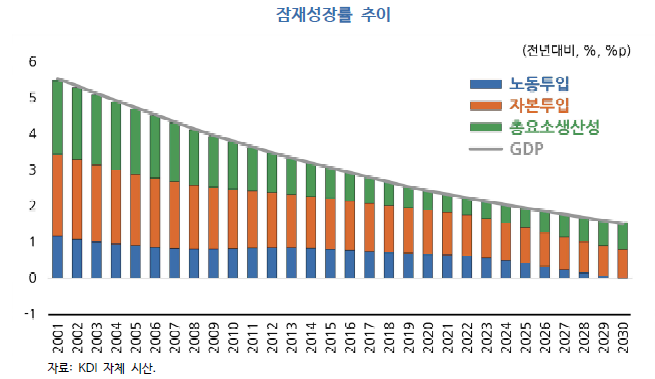
In the graph above, the blue line represents the impact of “Labor Input,” the red line signifies “Capital Input,” and the green line illustrates “Total Factor Productivity” on South Korea’s potential growth rate. By 2029, the number of people retiring will surpass those entering the workforce, effectively nullifying any growth contribution from “Labor Input.” Furthermore, with capital input and total factor productivity not expected to rise significantly, the overall growth rate is projected to decline.
As one of the world’s leading low-birth-rate countries, South Korea anticipates a substantial increase in expenditures for national pensions and basic pensions due to the growing number of retiring Baby Boomers. This demographic shift is expected to play a significant role in pulling down South Korea’s growth rate.
As individuals age beyond 65, their spending on new goods or large expenditures naturally decreases, while healthcare expenses increase. Ordinary citizens, particularly those with modest incomes, may find it difficult to sustain their livelihood solely on pensions after retirement, compelling them to continue working, even if it’s not for a substantial income. This situation carries the drawback of potentially reducing job opportunities for younger generations and may not lead to significant development as these jobs often do not enhance productivity.
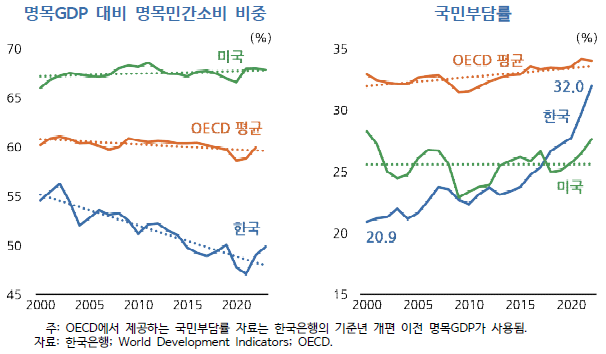
As shown in the image above, the blue line representing South Korea’s nominal private consumption as a proportion of nominal GDP reveals a continuous annual decline. This contrasts sharply with the United States (top line) and the OECD average (middle line), which maintain relatively stable levels.
This trend indicates a gradual decrease in South Koreans’ purchasing power. Contributing factors include: 1. South Korea’s exceptionally high private education expenses (to be discussed later), 2. A large number of individuals with high household debt due to exorbitant housing prices, and 3. Many elderly individuals who, after repaying their mortgage loans upon retirement, own a home but possess very little liquid cash. These are just some of the numerous reasons.
The graph on the right depicts South Korea’s rapidly soaring “National Burden Ratio.” South Korea boasts an extremely well-established healthcare system. However, some individuals exploit this system, engaging in what is colloquially referred to as ‘medical shopping,’ visiting hospitals hundreds, or even over a thousand times a year.
Moreover, with the increasing elderly population aged 65 and over, the number of individuals frequently visiting hospitals is growing, consequently pushing up the national burden ratio. As the population aged 65 and over is projected to further increase, this graph is highly likely to continue rising in the future.
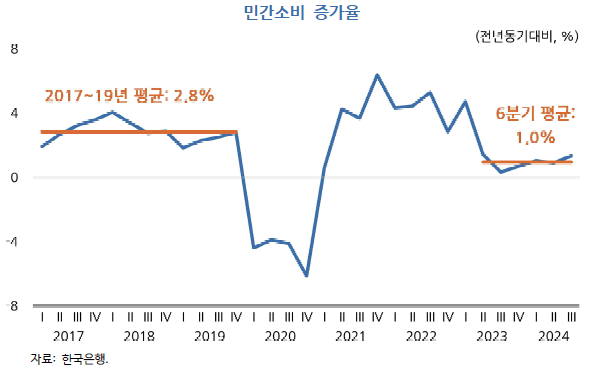
Since the second quarter of 2023, private consumption has maintained a low growth rate of around 1%, identified as a primary factor driving sluggish domestic demand. The average private consumption growth rate from 2017 to 2019 was 2.8%, but recent analysis shows that the average for the past six quarters has been a mere 1.0%.
While short-term factors may have contributed to the recent low growth in private consumption, it is also plausible that a medium-to-long-term declining trend, reflecting structural aspects of the economy, is playing a role.
#Korea #SouthKorea #KoreaSociety #KoreaEconomy